
Thermal bridging: The missing key to low energy building design
Thermal bridging through building facades has been overlooked or over-simplified by designers and building energy codes and standards in the past. This has led to higher space heating and cooling loads, occupant discomfort, and higher risk of condensation. How many times have we heard of highly rated energy efficient buildings consuming more energy than their energy models predicted? Most of these buildings did not have poor performance due to a lack of insulation, but due to not adequately addressing thermal bridging. Many buildings have more heat loss through thermal bridging than previously thought. It is by addressing these areas that buildings can achieve significant performance gains to help meet targets for low energy performance targets.
A breakdown of heat flow by façade components shows that 78% of the total heat loss comes from thermal bridging.
What is a thermal bridge?
Thermal bridging in facade assemblies occurs when:
Thermally conductive components bypass insulation creating a “shortcut” for heat flow. Examples include: structural framing such as studs, girts, and fasteners, or larger components like balconies
Change in geometry that includes a difference in exterior to interior surface area. Examples include: corners, roof-to-wall interfaces, and soffits
Misalignment in insulation between assemblies. Examples include: intermediate floors, at-grade details, and window-to-wall interfaces.
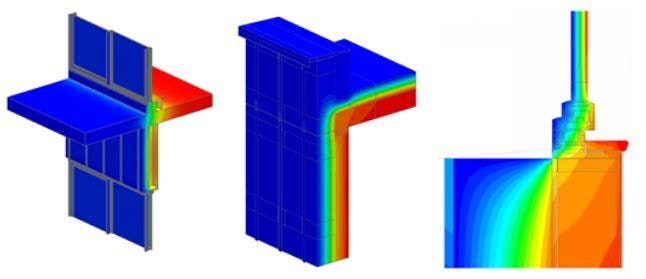
Figure 1 – Thermal Bridge Types - Bypassing insulation (left), Change in geometry (middle), Misaligned insulation (right)
Impact on Thermal Performance
While some of these thermal bridges are obvious, some that are not as obvious can have a significant impact on the façade’s thermal performance. An example of this is shown in the façade effective R-value of a 40-story high-rise residential building.
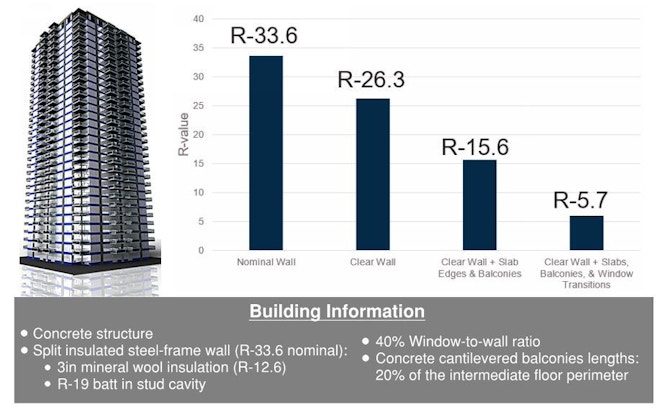
Figure 2 – Effective R-value of Example Building Façade with Thermal Bridging
Thermal performance of the façade drops when thermal bridges are accounted for. A breakdown of heat flow by façade components shows that 78% of the total heat loss comes from thermal bridging. Under traditional building energy codes and standards thermal bridging at wall assemblies, intermediate floors, and balconies should be counted, reducing actual performance to an effective R-15.6, less than half of the nominal R-33.6. Many modelers using the traditional parallel path approach fail to fully account for the full impact of these thermal bridges. Furthermore, this value still misses the thermal bridging at the window-to-wall transition which account for 61% of the façade’s heat loss.
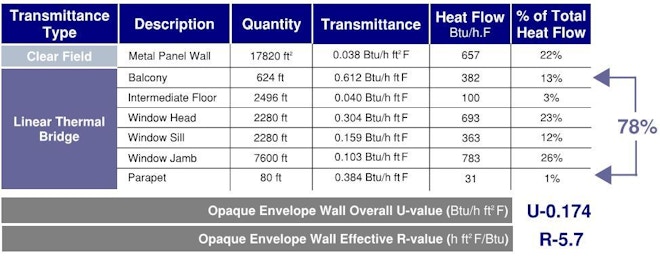
Figure 3 – Heat Flow Calculation of Example Building Façade with Thermal Bridging
Window-to-wall transitions are one of the most potentially impactful thermal bridges in the façade because it often has the largest interface length. In the above example there are over 2.3 miles of window-to-wall transitions and making minor adjustments to the detail, like aligning the window closer to the insulation, can have a significant impact on the overall thermal performance.
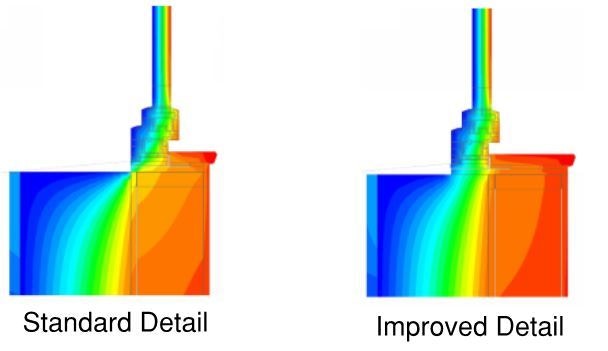
Figure 4 – Temperature Distribution of Window Sill Details
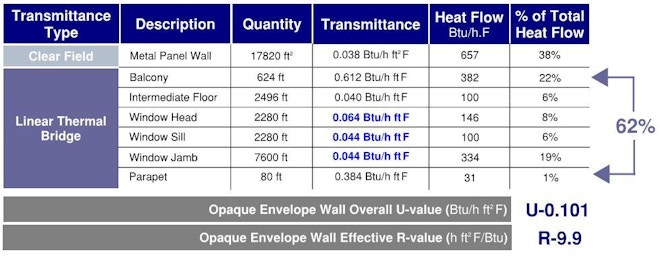
Figure 5 – Heat Flow Calculation of Example Building Façade with Improved Window-to-wall Transition Details
Thermal Bridging in Curtain-wall and Window-wall Assemblies
One of the key challenges facing the façade industry is the impact of thermal performance in curtain-wall and window-wall assemblies. While thermal bridging through vision sections of these systems are well understood and reliably modeled, simulating thermal bridging through spandrel sections is not. Spandrel sections have highly conductive framing surrounding insulation and complex heat flow paths that may be difficult to capture by most 2D thermal models. These complex paths can lead to higher total heat flows than what’s predicted in the models. An example of this is shown with a standard window-wall system. The expected thermal performance for a 9 ft high floor-to-floor window wall system with a width of 36 inches for various spandrel heights, 3 inches of mineral wool insulation in the spandrel, and a vision lite with COG U-value of 0.32 Btu/h ft2°F, tops out at around R-6 which is significantly less than the nominal R-12.6 insulation in the spandrel.
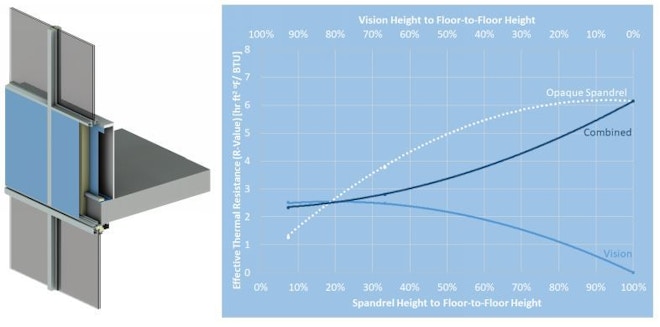
Figure 6 – Effective R-value of Standard Window-Wall Assembly with various Spandrel and Vision Section Areas
The complexity of thermal bridging through spandrel sections is also seen in the surface temperatures. A comparison of predicted surface temperatures for the same system evaluated with 2D and 3D models reveals different temperature distributions. 2D simulations calculate average temperatures at best, but the coldest temperatures are required to evaluate the risk of condensation. Because 3D models can account for lateral heat flow, they can better reflect reality and are able to identify precise components in the system for improvement.
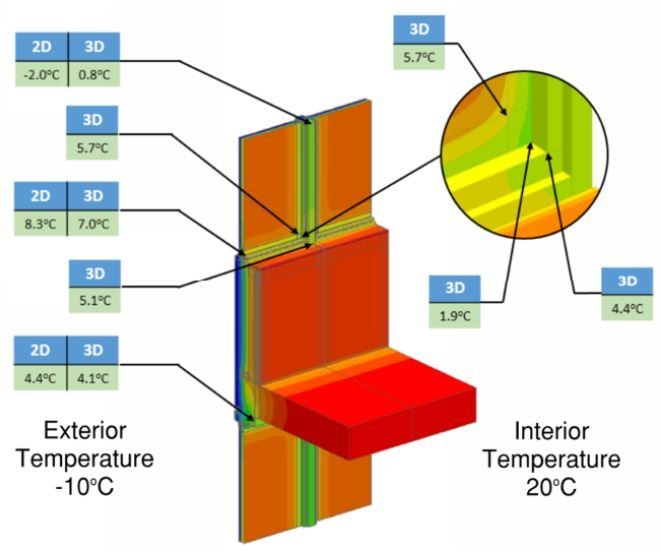
Figure 7 – Simulated Surface Temperatures of Standard Window-Wall System using 2D and 3D Models
Tools and Resources
There are numerous tools and resources to help account for thermal bridging in façade design. Thermal bridging catalogues such as the Building Envelope Thermal Bridging Guide (BETB) have pre-calculated thermal bridging values for the industry to use. The BETB catalogue has over 500 details based on various construction types from curtain-wall, window-wall, steel-frame, concrete, and wood-frame assemblies. The performance ranges from common thermally inefficient details to highly efficient details for Passive House design. The BETB Guide is periodically updated with new details to meet industry needs. A companion calculator that enables designers to calculate overall thermal performance of building facades is also available through BC Hydro. The spreadsheet calculates the façade U-value and effective R-value based on take-offs of the building’s areas, linear, and point thermal bridges.
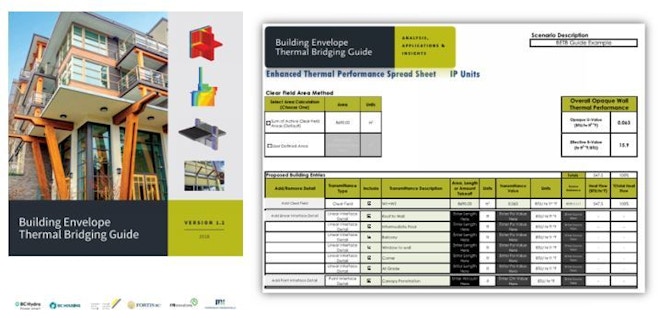
Figure 8 – Building Envelope Thermal Bridging (BETB) Guide (left), Thermal Bridging Spreadsheet (right)
In the Fall of 2021, an online resource, thermalenvelope.ca, will launch with online access to the BETB thermal bridging database. This website will allow users to search and compare thermal bridging details, and the site includes an integrated thermal calculator for calculating building envelope overall thermal performance. The website also includes instructional videos on thermal bridging and how to use the website.

Figure 9 – thermalenvelope.ca Screenshots – Thermal Bridging Catalogue (left), Thermal Calculator (right)
CONCLUSION
Recognizing and mitigating thermal bridging is an important part of the strategy to meet low energy targets. When thermal bridging is not properly accounted for, it can lead to greater heating and cooling demand. Building standards such as Passive House understand this and have made mitigating thermal bridging one of the core tenants of low energy building design. Many other building energy codes and standards that have a goal of reaching net-zero energy performance, such as NECB 2017, the BC Energy Step Code, and the Toronto Green Building Standard are following this by requiring comprehensive thermal bridging calculations. This is also catching on in other jurisdictions. The NYC 2020 Energy Conservation Code now requires that thermal bridging values be reported in design and has plans to introduce stringent requirements in the future. With net-zero energy targets on the horizon and stricter building energy requirements coming, it is time for designers and manufacturers to pay more attention to thermal bridging as this is a bridge we must cross for a better future.

Ivan Lee
Building Science Consultant
Morrison Hershfield now Stantec
Ivan Lee, P.Eng., M.A.Sc., is a Building Science Consultant with the Building Performance Analysis group with a focus on heat transfer and hygrothermal analysis. Ivan has been involved with various past projects including 3D thermal modelling to assess thermal bridging details for the Building Envelope Thermal Bridging Guide (BETB Guide), and the Guide to Low Thermal Energy Demand for Large Buildings (Low TEDI Guide), as well as condensation analysis of window wall and curtain wall glazing systems. Ivan also has experience in hygrothermal modelling of building envelope assemblies to determine the risks of moisture accumulation and risk of freeze-thaw damage in masonry.


Looking for something specific?
Search our extensive library.
FTI’s SKINS email is the central source for the latest in building skin trends and research.
All emails include an unsubscribe link. You may opt out at any time. See our privacy policy.